Algo Tester
Stock Markets
One of the projects I'm most proud about is definitely the Algo Tester. In my spare time I tend to evaluatealgorithmic systems. I enjoy the enigmatic side to it, like solving a puzzle, but also what I learn from the markets.
To me the markets are very much an amalgamation of human behaviour, which plays to my psychological interests.
Philosophical discussions aside, anyone that has spent time designing algorithmic systems will know how much
work goes into testing a single system and most algorithmic ideas don't pan out.
A lot of time is spent on labourious work and manual processes.
A second driving factor for this project was very much that I found backtesting software a bit lacking.
The software is all very well written but couldn't always offer me the functionality to test a system through
my process, and understandably so, as these software applications are built for a wide audience.
So with enough hours spent on manual process eventually I simply decided to take the plunge and create something
that works for me.
I decided to use C# as my tool of choice on this. No other software was really required other than a python script
here and there to model the data, however eventually this can simply be incorporated into main project.
The project itself really revolves around doing certain tasks, speed and mathematics.
An extensive amount of time was spent with Object Orientation and using LINQ to accomplish this.
here and there to model the data, however eventually this can simply be incorporated into main project.
The project itself really revolves around doing certain tasks, speed and mathematics.
An extensive amount of time was spent with Object Orientation and using LINQ to accomplish this.
After mapping out all my process and the tasks involved, and what was lacking, I had a good idea of everything I had to do.
One of the issues I sit with is during the walkforward process. Often the systems get identified as being profitable however
in real terms below is a screenshot of how the system actually performs.
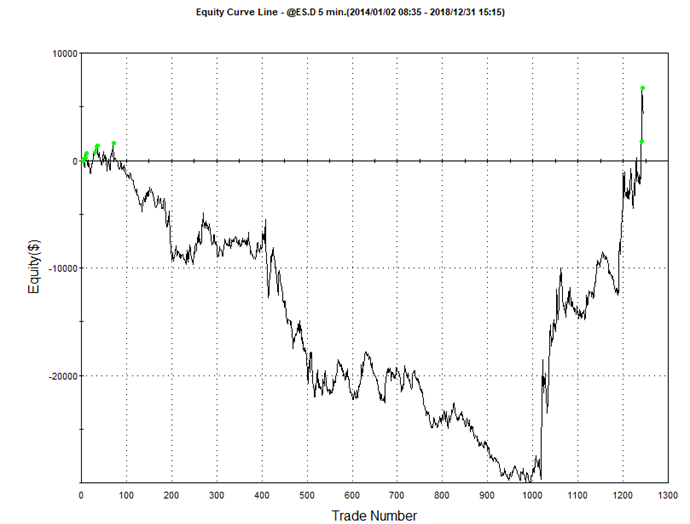
This is obviously not what I would consider a good system and would like to filter these out, but considering
most backtesting software (if they have the functionality available) it tends to only filter by Net Profit or
one or 2 more metrics, like Profit Factor.
To overcome this issue I added another metric - I call it my mScore.
I would draw an ideal system on the same chart, basically as if the system was increasing by 45 degrees (goldilocks zone)
and then try and correlate it to the existing performance. That is my first test (and the RSquare value in the pic below).
Secondly I would then measure the slope of the real Equity Curve.
I do realize that measure the Equity Curve slope is quite tricky, as there are many considerations that take place,
for example slopes change as the size of the chart changes, so a simple arctan isnt as simple as one would hope.
These were some of the hurdles one would navigate through on this approach.
The combination of these two values create my mScore and will give me a better idea how a system performs
rather than the metric of profits alone. I can then use the application to filter bad performing (but profitable) systems.
One of the issues I sit with is during the walkforward process. Often the systems get identified as being profitable however
in real terms below is a screenshot of how the system actually performs.
This is obviously not what I would consider a good system and would like to filter these out, but considering
most backtesting software (if they have the functionality available) it tends to only filter by Net Profit or
one or 2 more metrics, like Profit Factor.
To overcome this issue I added another metric - I call it my mScore.
I would draw an ideal system on the same chart, basically as if the system was increasing by 45 degrees (goldilocks zone)
and then try and correlate it to the existing performance. That is my first test (and the RSquare value in the pic below).
Secondly I would then measure the slope of the real Equity Curve.
I do realize that measure the Equity Curve slope is quite tricky, as there are many considerations that take place,
for example slopes change as the size of the chart changes, so a simple arctan isnt as simple as one would hope.
These were some of the hurdles one would navigate through on this approach.
The combination of these two values create my mScore and will give me a better idea how a system performs
rather than the metric of profits alone. I can then use the application to filter bad performing (but profitable) systems.
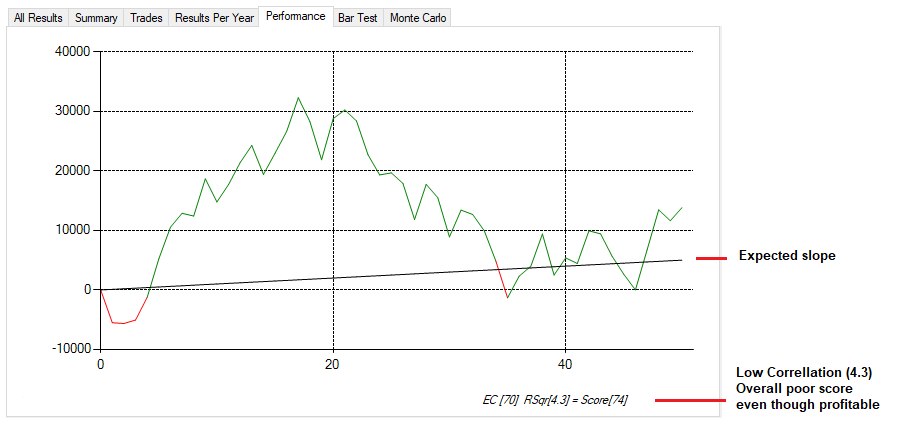
Here is an example of measuring the curve.
The example below shows a profitable system but a low correlation with the equity curve growth I would've expected
for a system of those amounts of trades and with that kind of leverage.
The Equity Curve slope received a high value (70 - not necessarily good) and the correlation received a low value (4.3)
which overall meant, that this system got a low rating.
Time will tell if this methodology works but what I enjoy is that because I have a bespoke system I can change
my methodology as my learning grows. And there's no other way to grow other than try, try, try...
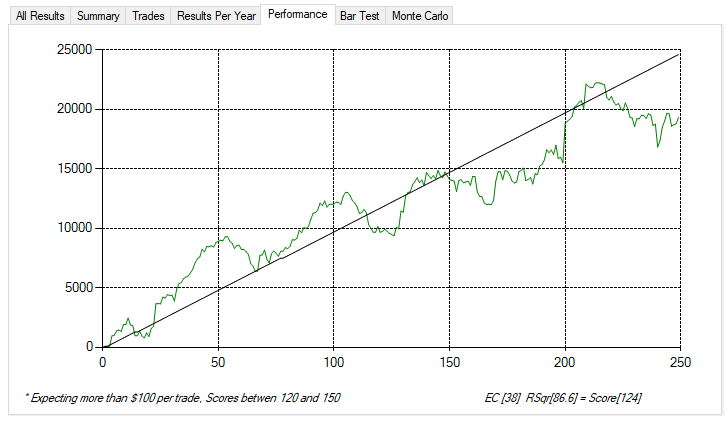
Example of better looking equity curve (hence rsqr score of 86 out of 100):
The example below shows a profitable system but a low correlation with the equity curve growth I would've expected
for a system of those amounts of trades and with that kind of leverage.
The Equity Curve slope received a high value (70 - not necessarily good) and the correlation received a low value (4.3)
which overall meant, that this system got a low rating.
Time will tell if this methodology works but what I enjoy is that because I have a bespoke system I can change
my methodology as my learning grows. And there's no other way to grow other than try, try, try...
Example of better looking equity curve (hence rsqr score of 86 out of 100):
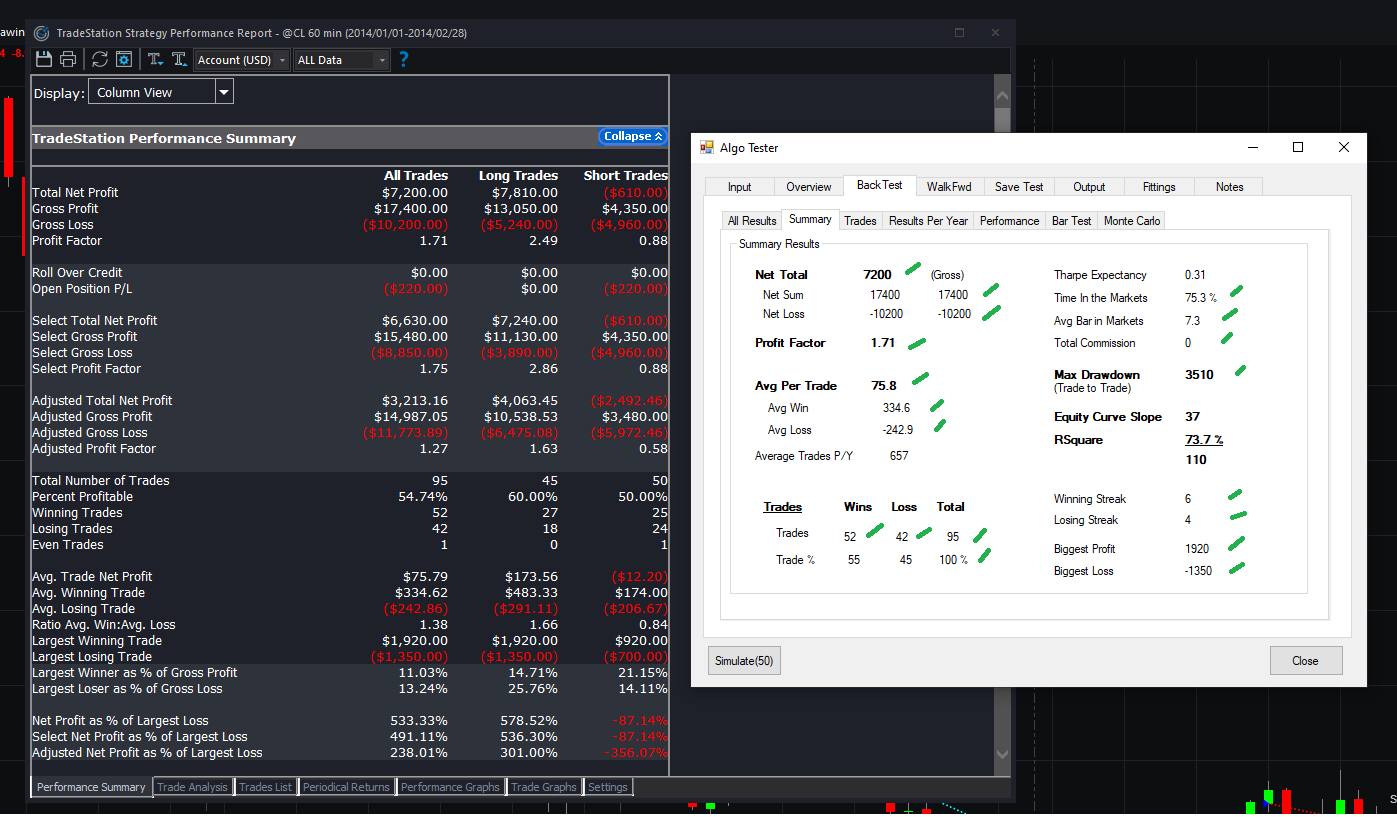
Finally to sanity test my project I compared it other backtesting software, to make sure that the results were similar.
These comparisons can be seen in the screenshots below.
If you have any questions or would simply like to chat this topic please feel free to message me
These comparisons can be seen in the screenshots below.
If you have any questions or would simply like to chat this topic please feel free to message me
Example1:
Example2: (2014-2019)
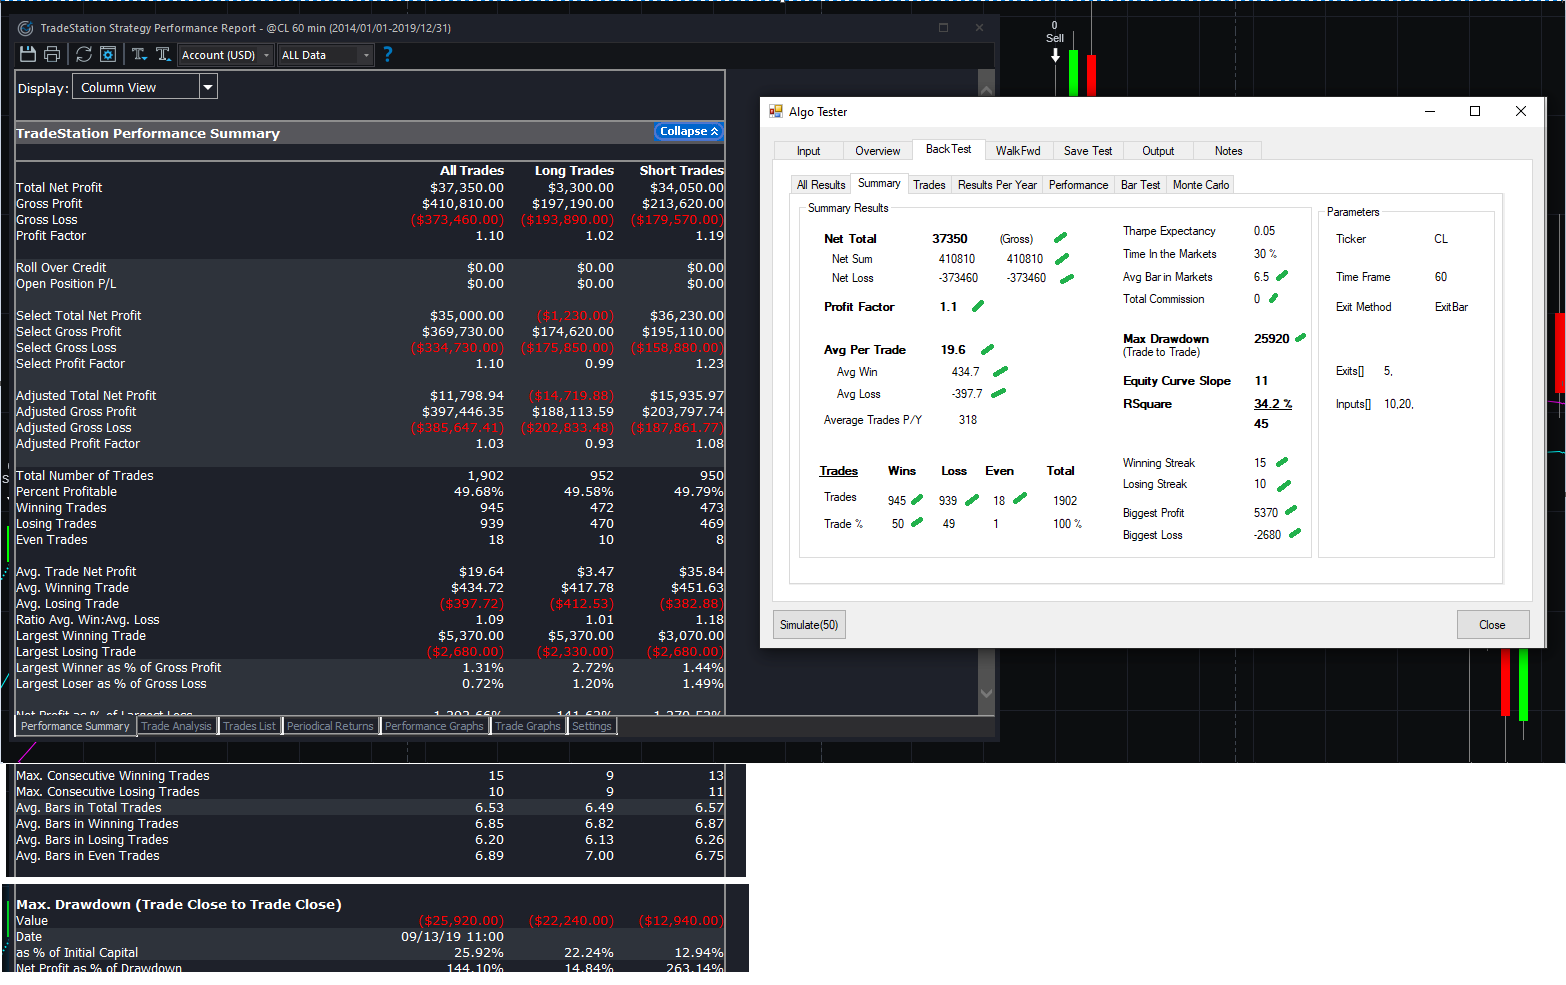
Example2: (2014-2019)
Created by RH [2020]