Qlik Models
Stock Markets
Below are some models that I worked on in my own time.Mostly because I was quite interested in the data to be honest.
Being the business user and the developer at the same time made things a lot easier, as I know
exactly what to look for as an investor and then being able to visualize that as a developer.
The hardest part do this was really just getting the data, however after a few weeks of scraping from a few sites
I was able to collect enough to start working.
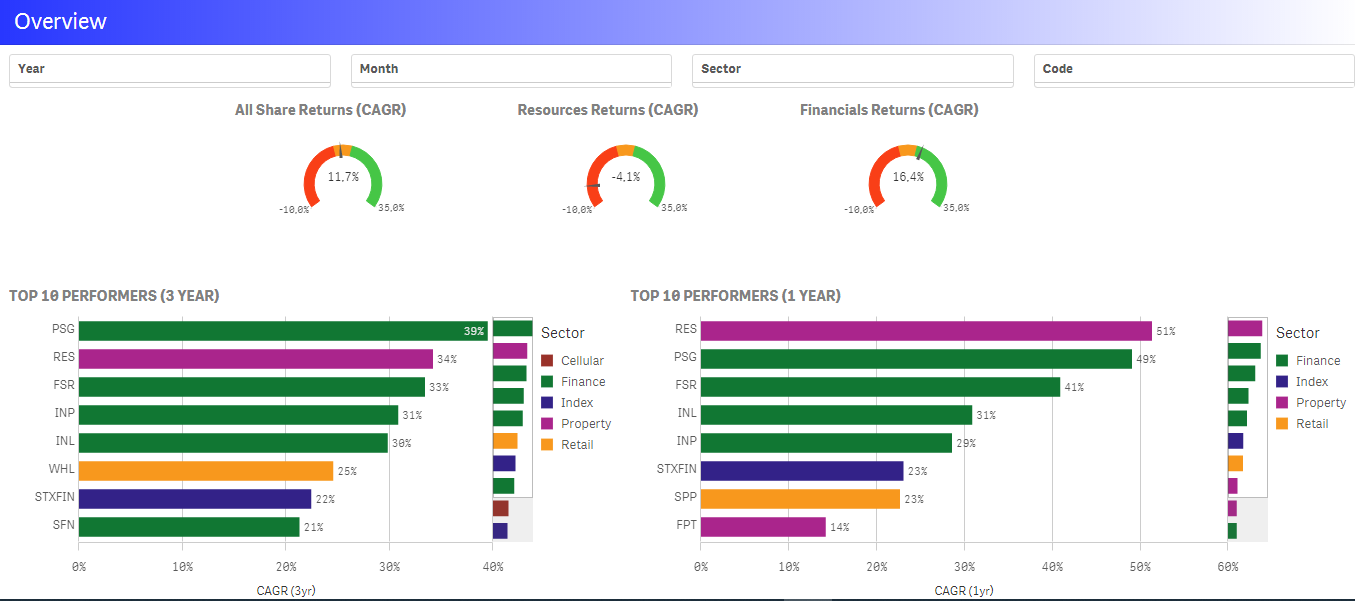
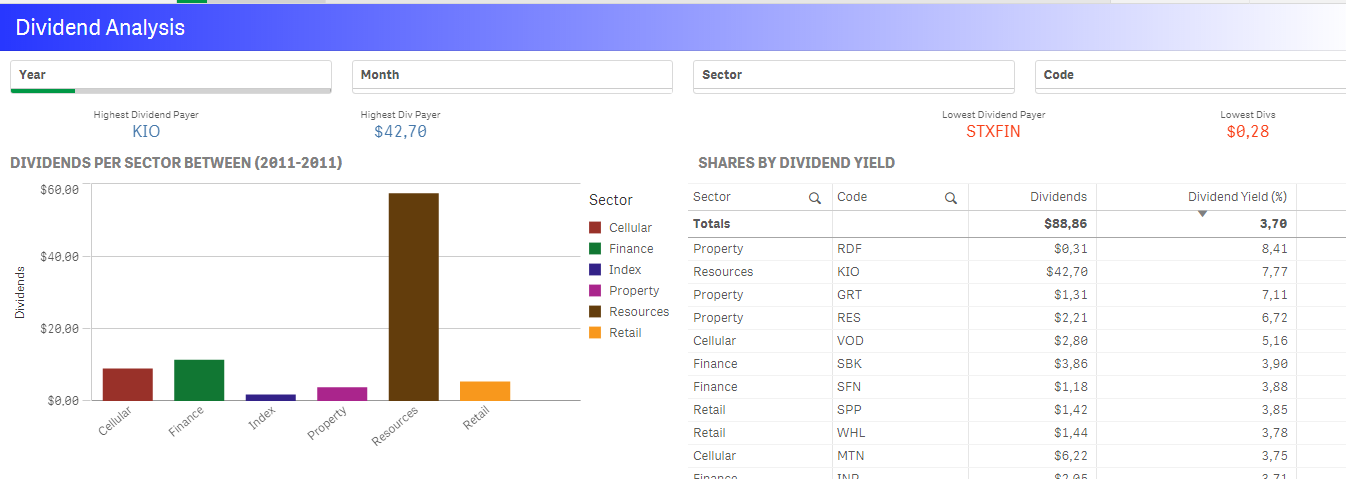
Description: Dashboard
View of how well the different sectors are doing and the top 10 performers for my selection period.The bars are also colour coded to the sector to assist in visually showing more information, like in which sectors do the Top10 sit in.
In this case it is easy to see that the best performing shares (in 2011) were sitting in the financial sector (coloured green).
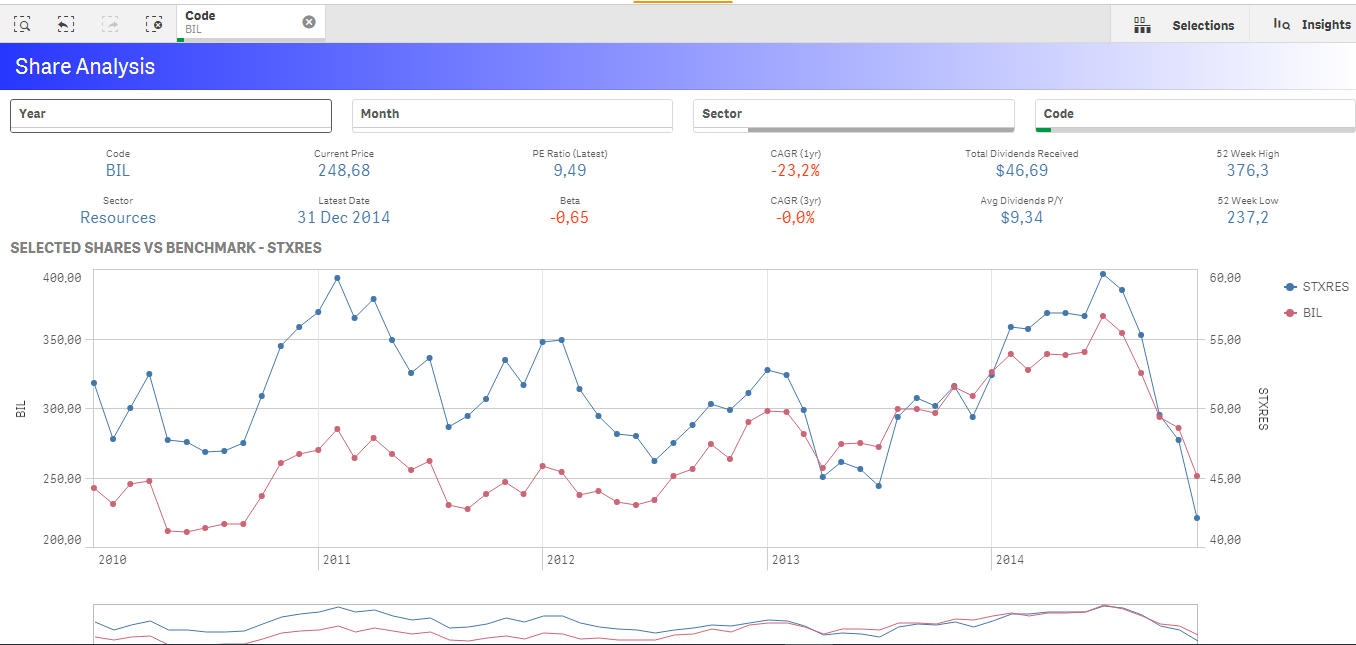
Description: Share Analysis
Key statistics on a specific stock. PE Ratio, CAGR, Dividends, 52 week high, 52 week low, etcFurthered with a line chart that displays the stock movement compared to the relevant index.
You'll notice that the Satrix Resi was automatically selected, as opposed to only the JSE J200
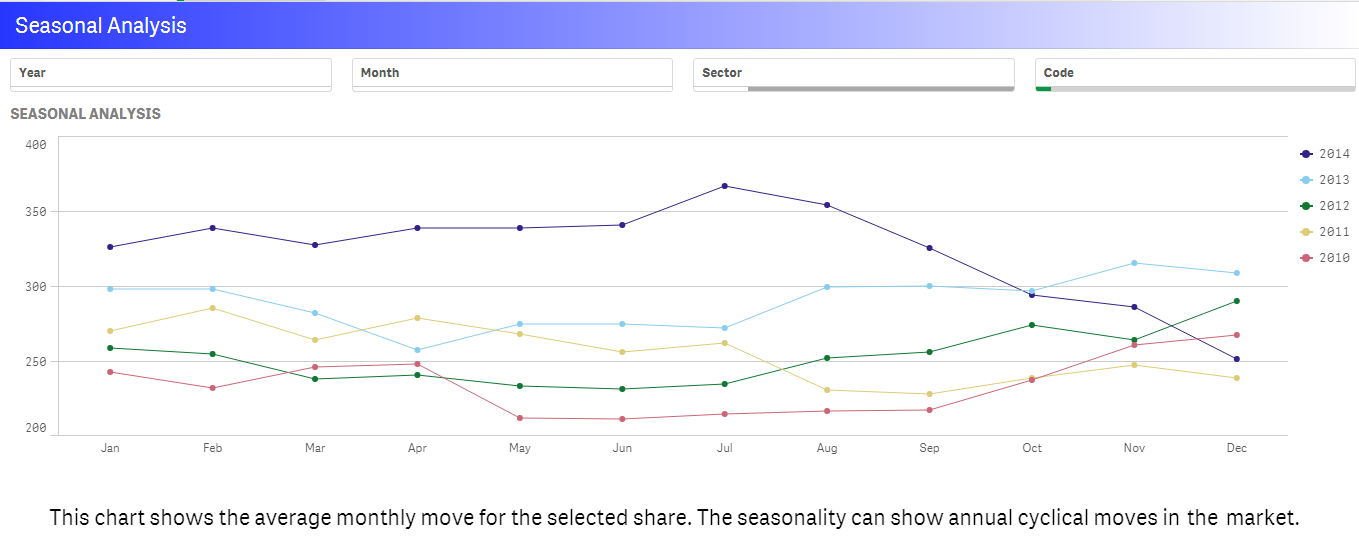
Description: Seasonality
View of the stock movements from January to December plotted across the years one will be able to pick upany kind of trend. (For example often, albeit not massively strong, there's upward momentum in the final months - Oct to Dec,
and downward movement from Jan to Apr with this specific stock).
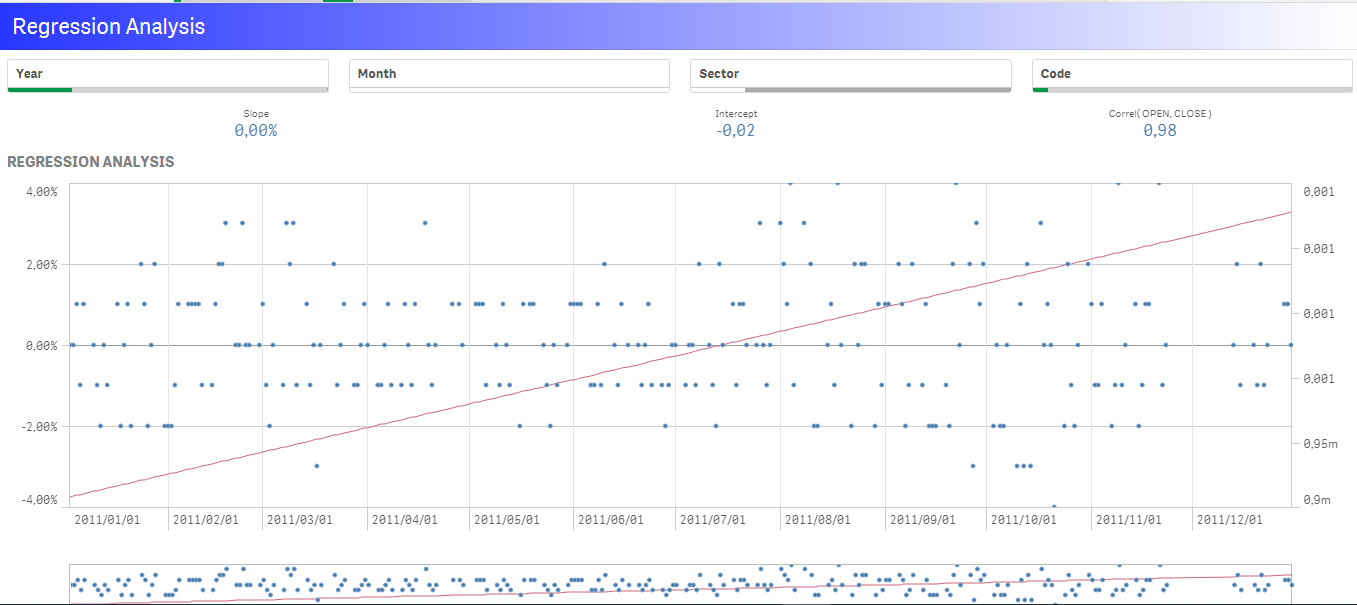
Description: Regression
Plotting the daily gains of the stock one can chart a linear regression model, showing the line, calculating the slopeand intercept. With advanced analytics one would be able to take this further.
Description: Dividends
Finally a view on some of the more fundamental measures like dividends, dividend growth and dividend yield is shown.This helps those with high yield strategies, like the "Dividend Aristocrat" strategy on the market
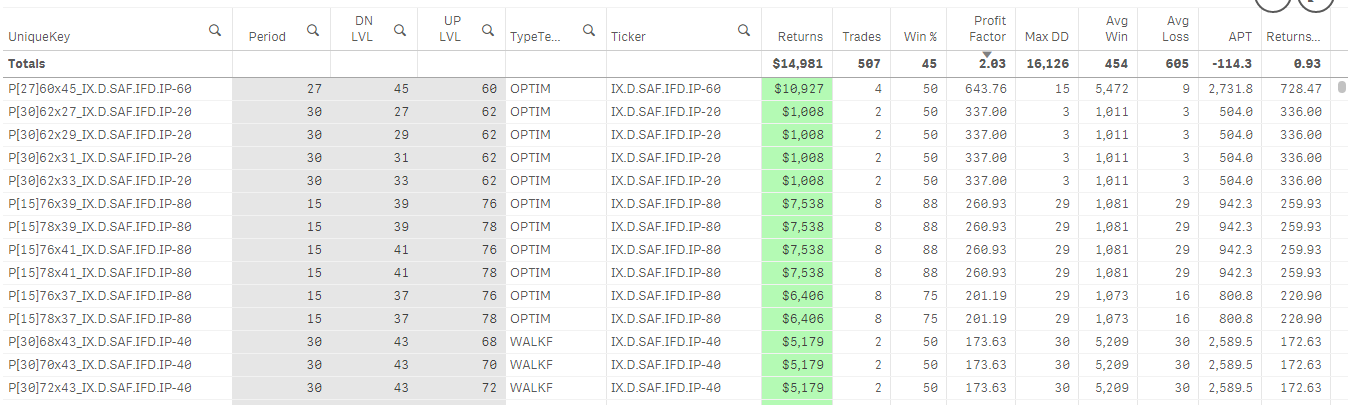
Algorithmic Trading Systems
Algorithmic systems or "Algos" is another hobby of mine that involves really just finding mathematical patterns in the stock markets.Jesse Livermore - Another lesson I learned early is that there is nothing new in Wall Street. There can't be because speculation is as old as the hills.
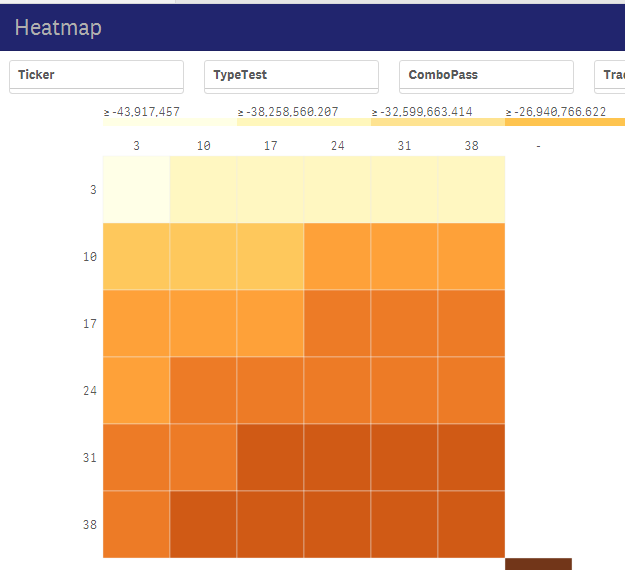
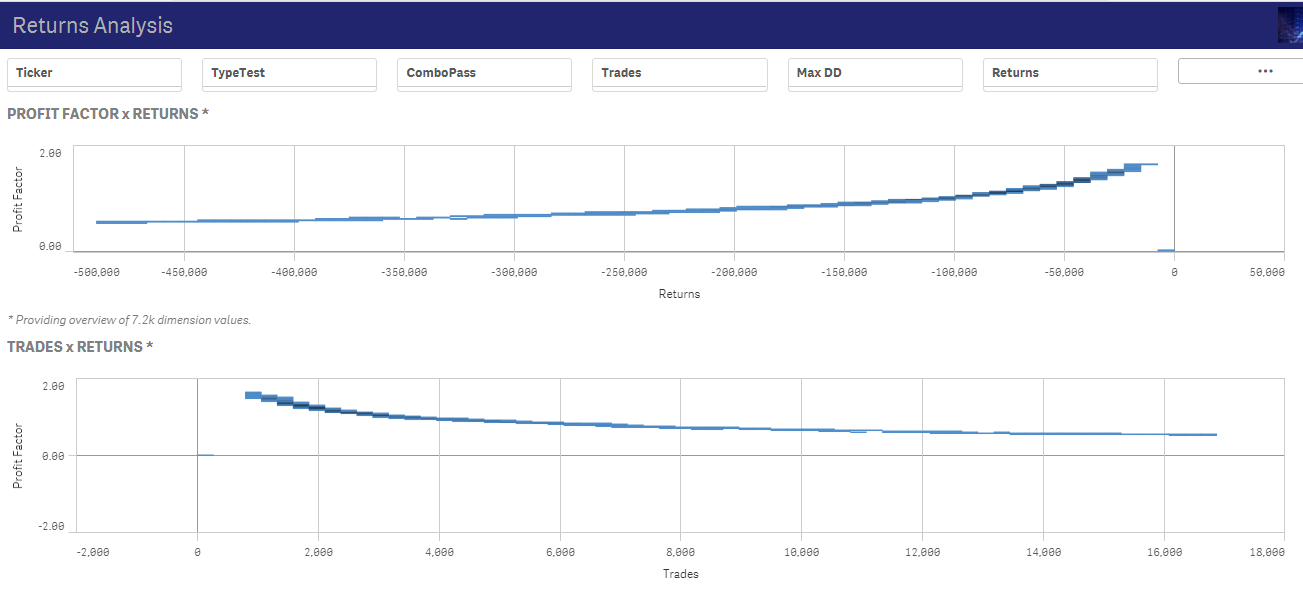
So to help further analyze results of various optimzation testing I used Qlik to help visualize the results.
Here are some screenshots of the app:
Created by RH [2020]