Project Description
26 May 2020
Connors RSI Test
Description:
The project delves into the famous ConnorsRSI trading strategy.
The strategy is simple enough, using the RSI calculation it looks for a short term mean reverting bounce
on the markets. By going long when the RSI has crossed over from below X value to above X value a person
can go long and hold for a day or two.
Data is collected from Stooq.com on the S&P (daily Open, High, Low, Close) from 1970 to 2019
Strategy: ConnorsRSI - School.stockcharts.com
Data: Stooq.com
Strategy: ConnorsRSI - School.stockcharts.com
Data: Stooq.com
See the workings on github here:
Connors RSI
Process:
Data is collected and transformed into a panda dataframe. From here the RSI(14 period) indicator is added.
Once this has been done a few more indicators are added, like the SMA200, SMA50, isUpday,...
A function is then used to test whether the day has crossed from below the Tested Value to Above the Tested Value.
The days crossed would be buy signals. All the buy signals are then saved in a new dataframe and analyzed for profitability.
Different values are then used to determine the optimal "Tested Value" (10,20,30...) to determine profitability over the complete timeframe.
What has not been done is:
- seperating the data between In-Sample and Out-Sample, as the feasibility of the strategy was only tested.
- data normalization to equalize moves in the 1970s to the 2000s
What has not been done is:
- seperating the data between In-Sample and Out-Sample, as the feasibility of the strategy was only tested.
- data normalization to equalize moves in the 1970s to the 2000s
From here further analysis can be done with a proper exit.
Conclusion:
Holding for 1 day showed a lot of promise with the values where the RSI crosses over 30, 40 or 70.
70 seemed quite interesting as most people use 70 as a signal to exit not enter
(sometimes common knowledge is not always as true as one would think).
Further testing on the idea would definitely be recommended,
- (would other filters work improve it? SMA, Volume, etc)
- (would a better exit strategy work? holding for more days, waiting for the 80 RSI, etc)
Comparison:
It is import to always double check ones work, as mistakes can happen without one even noticing.
To sanity check - I decided to compare it with backtesting software using tradestation:
Code:
It is import to always double check ones work, as mistakes can happen without one even noticing.
To sanity check - I decided to compare it with backtesting software using tradestation:
Code:
EasyLanguage Code
Created by RH [2020]
inputs: RSIPeriod(2), RSICheck(10);
vars: iRSI(0);
iRSI = RSI(Close, RSIPeriod);
if (iRSI crosses above RSICheck) Then
begin
Buy next bar at market;
end;
if BarsSinceEntry = 1 then
Sell next bar at market;
vars: iRSI(0);
iRSI = RSI(Close, RSIPeriod);
if (iRSI crosses above RSICheck) Then
begin
Buy next bar at market;
end;
if BarsSinceEntry = 1 then
Sell next bar at market;
Results from TradeStation: [2005 to 2020]
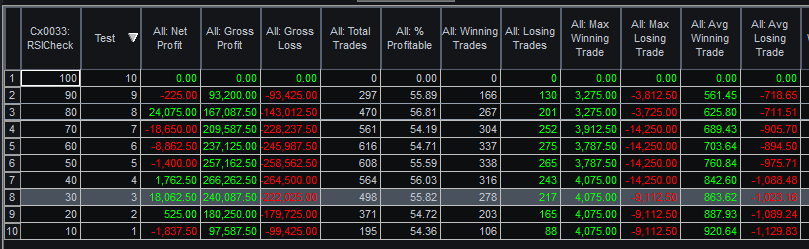
It is important to note that the timeframes and the data will differ between Stooq and Tradestation,
which means the results will differ.
However what is quite interesting is that the overall view doesnt change significantly.
In Python 30 and 70 was significant and then in Tradestation 30 and 80 yield good results.
This sanity check helps me evaluate whether further testing is required and in this case there's definitely something there.
Created by RH [2020]