Project Description
21 May 2020
Description:
The project was really two-fold, in that it was an exercise to help me practise python coding,
as well as do a bit of statistical discovering on the ALSI Market.
The ALSI Market is the Stock index of the Top40 largest companies in South Africa.
One can hold a position in the Top40 in several ways, like buying the Satrix40 shares or
buying a "Future" on the market. Futures are quite risky business as they are leveraged products
(in other words you loan money to own a bigger position - like when you take a bond to buy a house).
See the workings here: ALSI Analysis
Discoveries:
Some of the discoveries found in the workings:
- On a large scale value is found at the 10,000; 30,000 & 50,000 marks (less at the latter)
- Most days have a movement of between -2 and +2% (important for options trading?)
• the most frequent occurrences being 0-1% gains
- Greater than 30% drawdowns on the markets are rare (only 3 occurrences in 20 years)
- Only 13% of the time do we close on all time high price.
- Top 10 Worst days and the Top 10 best days with their respective values
• Both Worst and Best days seem to happen during major drawdown periods
• (probably because of the volatility during that time).
- A quick look at 5, 15 and 25 day later gains are evaluated.
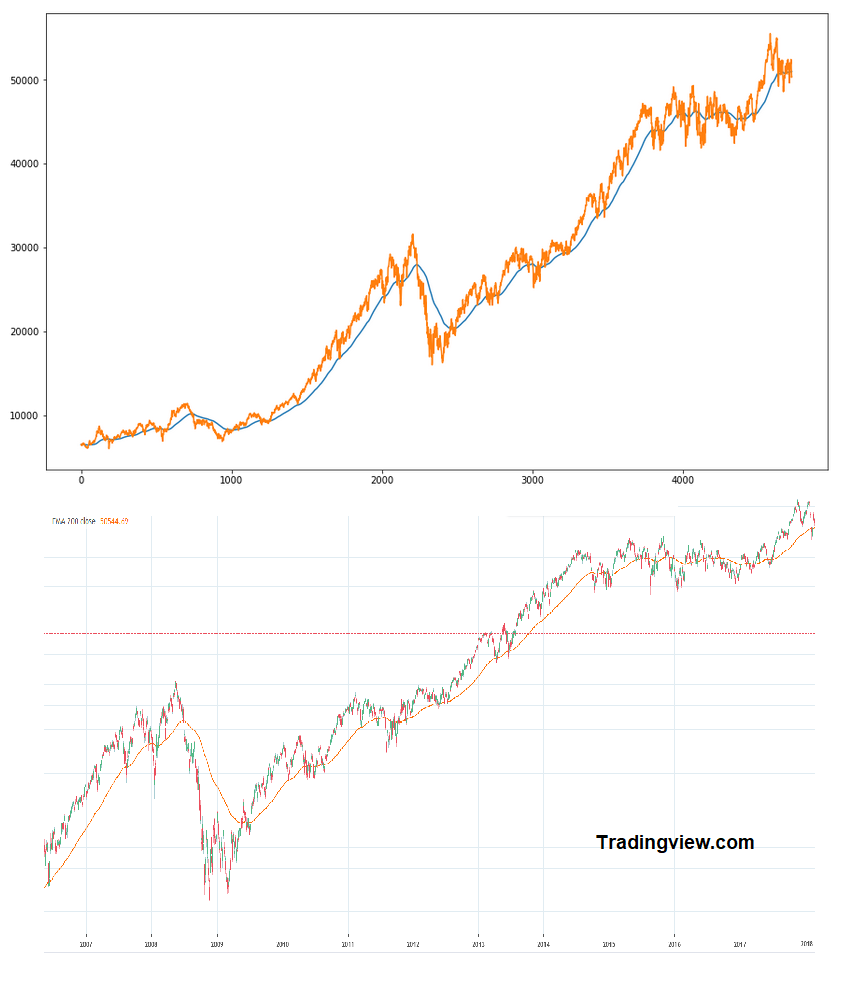
- Difference between EMA200 and Closing price (can it work as an oscillator?)
Tech findings:
- It's amazing how easy it was to convert 5minute data to EOD data using the resample function.
- Also creating the exponential moving average all comes from libraries.
Adding SMA or EMAs are both very simple.
- Charting with a date as the index is VERY slow, rather chart using a row number(int) initially.
Python Code to convert timeframes:
Created by RH [2020]
Some of the discoveries found in the workings:
- On a large scale value is found at the 10,000; 30,000 & 50,000 marks (less at the latter)
- Most days have a movement of between -2 and +2% (important for options trading?)
• the most frequent occurrences being 0-1% gains
- Greater than 30% drawdowns on the markets are rare (only 3 occurrences in 20 years)
- Only 13% of the time do we close on all time high price.
- Top 10 Worst days and the Top 10 best days with their respective values
• Both Worst and Best days seem to happen during major drawdown periods
• (probably because of the volatility during that time).
- A quick look at 5, 15 and 25 day later gains are evaluated.
- Difference between EMA200 and Closing price (can it work as an oscillator?)
Tech findings:
- It's amazing how easy it was to convert 5minute data to EOD data using the resample function.
- Also creating the exponential moving average all comes from libraries.
Adding SMA or EMAs are both very simple.
- Charting with a date as the index is VERY slow, rather chart using a row number(int) initially.
Python Code to convert timeframes:
def createTables(valformat):
#Different Columns have different calculation techniques
# -- Add Closing --
tmp2 = tmpAllData.resample(valformat, level=0).last()
df = tmp2[['Date','Close']].dropna()
# -- Add Highs --
tmp2 = tmpAllData.resample(valformat, level=0).max()
df = pd.merge(df, tmp2[['Date','High']], on='Date').dropna()
# -- Add Lows --
tmp2 = tmpAllData.resample(valformat, level=0).min()
df = pd.merge(df, tmp2[['Date','Low']], on='Date').dropna()
# -- Add Open --
tmp2 = tmpAllData.resample(valformat, level=0).first()
df = pd.merge(df, tmp2[['Date','Open']], on='Date')
return df
Created by RH [2020]